
Accounting Reports
1. Company and Accounts
General Ledger
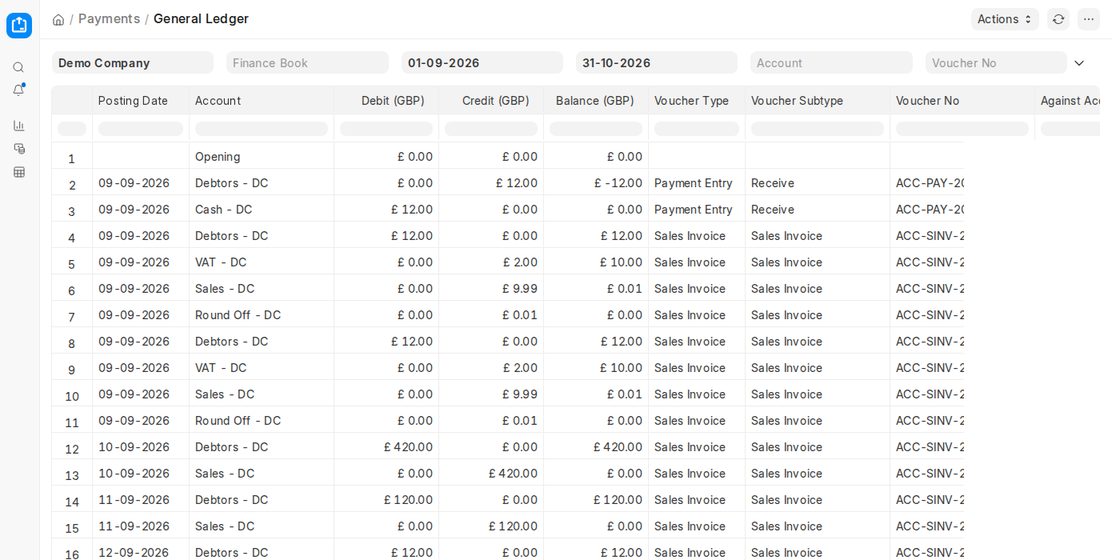
General Ledger is one of the most important accounting reports in ERPNext. It offers a thorough overview of every transaction that has been entered into your system, broken down by account. The General Ledger shows both sides of every transaction, and every accounting entry includes at least one debit and one credit.
You can access general ledger by going to:
The GL Entry table, the foundation of ERPNext’s accounting engine, powers this report. It keeps track of all financial transactions, including journal entries, payments, invoices, and other kinds of transactions.
The General Ledger Report’s salient features include:
1. Detailed Listing of Transactions
This is a list of all debits and credits made to all accounts. This enables accountants to track the flow of funds or value throughout the company.
2. Strong Filters
Several filters, including Account, Voucher No, Party Type and Party, Cost Centre, Project, Finance Book and Date Range, are available in the report. These filters assist in focussing the data on particular needs, such as verifying all transactions with a particular supplier during a given month.
3. Categorize By
With the Categorize by filter you can arrange the results by:
- Voucher or Voucher (Consolidated) (to see each transaction; the default is Voucher (Consolidated)),
- Account (to view every entry in a single ledger),
- Party (to observe activities involving a particular client or supplier).
4. Opening and Closing Balances
The report displays the opening balance, debits, credits, and closing balance for every group (such as an account). This makes sure there are no unexpected entries and that the books are balanced.
5. Multi-Currency Support
For businesses that deal with multiple currencies, the Presentation Currency filter shows the report in another currency, and Add Columns in Transaction Currency adds the amounts in the transaction currency. This is particularly helpful when interacting with foreign clients or vendors or when balancing bank accounts abroad.
2. Accounting Statements
2.1 Accounts Payable and Receivable (AR/AP)
ERPNext’s Accounts Receivable (AR) and Accounts Payable (AP) reports are crucial for handling the inbound and outgoing payments for your business.
To access them, go to:
These reports clearly show the amounts your business owes to suppliers (AP) and the outstanding balances that your customers owe (AR).
2.1.1 Accounts Receivable:
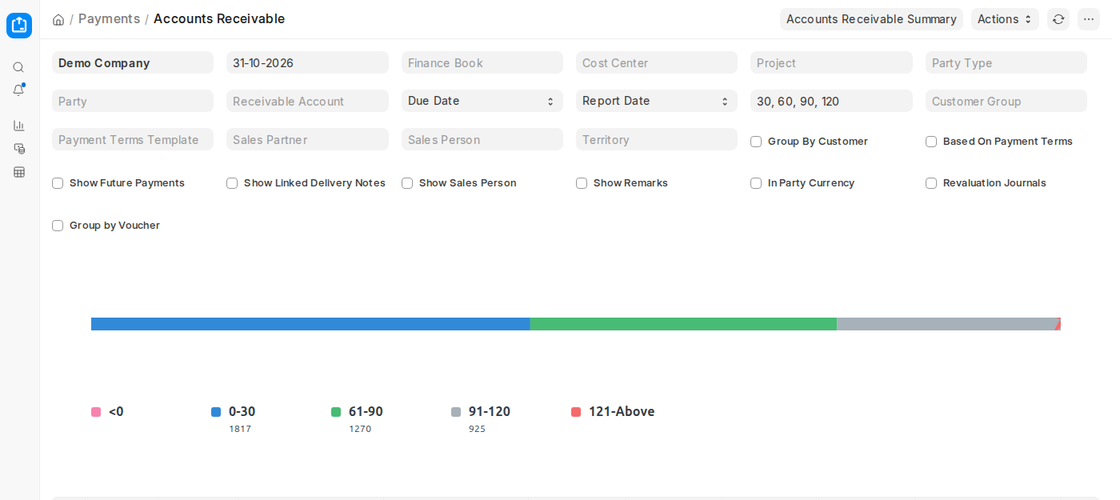
A list of unpaid or partially paid sales invoices arranged by customer is displayed in the Accounts Receivable report. For every client, you can see:
- Total invoiced amount
- Amount paid
- Unpaid balance
- Receivables’ ageing
This helps in determining which clients are past due and for what duration; they are categorised by the ageing ranges in the report filter (30, 60, 90, 120 by default: 0–30, 31–60, 61–90, 91–120 and 121-Above days).
2.1.2. Accounts Receivable based on Payment Terms:
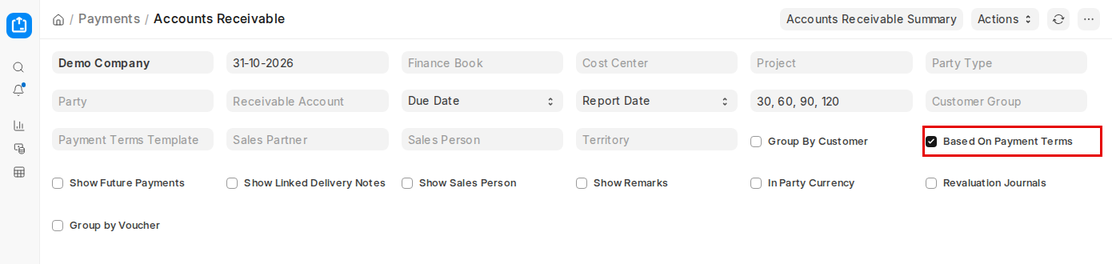
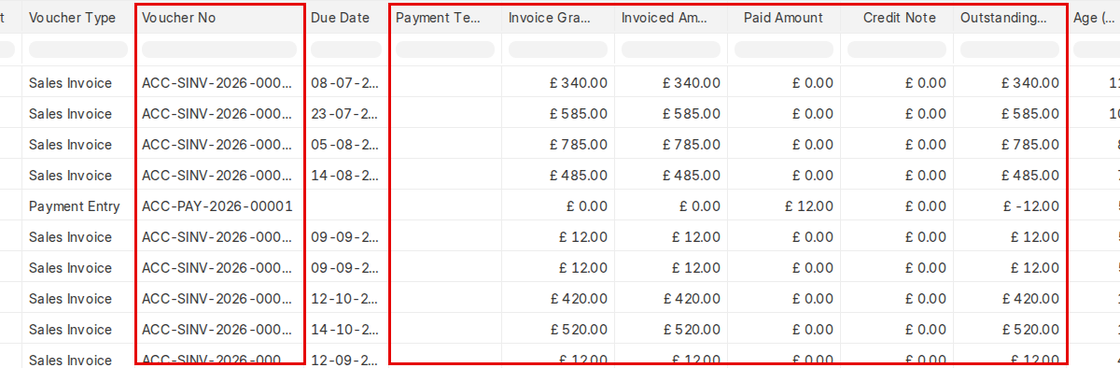
You can also view AR by Payment Terms using ERPNext. The invoice’s payment terms specify how it is divided into several due dates (for example, 50% due in 15 days, 50% in 30 days).
By ticking the “Based On Payment Terms” option in the Accounts Receivable report, you can make this view available. When activated, the report displays:
- Amount invoiced for each term of payment
- Amount paid for each term
- Amount Due Based on Due Dates
The earliest dues are paid off first when payments are applied to the terms using the FIFO (First In, First Out) method. Based on the customer’s agreed-upon payment schedules, this report provides a more realistic view of short-term cash inflows.
2.1.3. Accounts Payable:
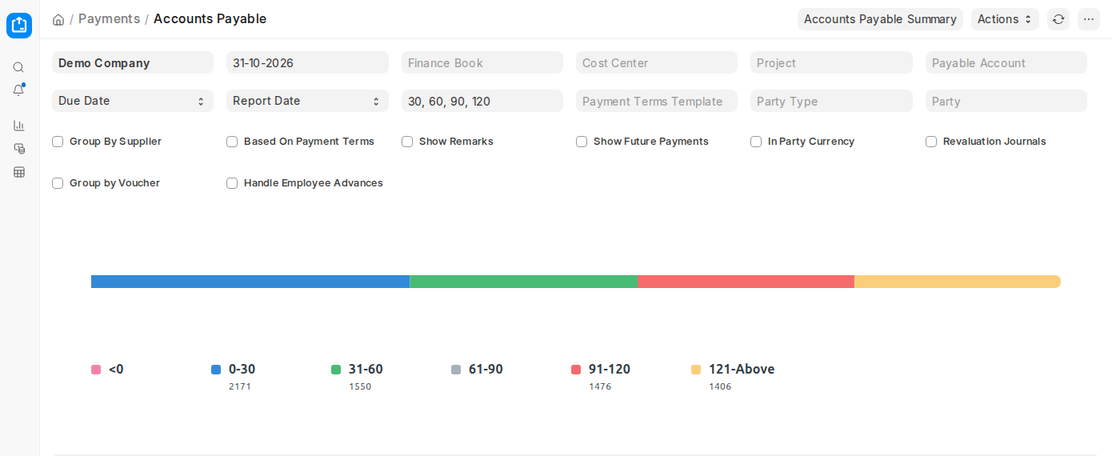
To access this, go to:
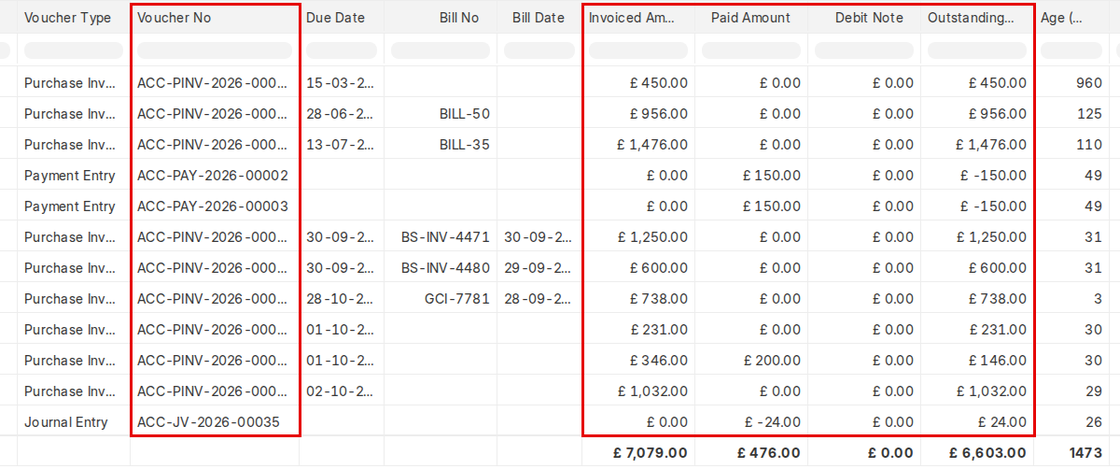
This report functions similarly, but it keeps track of the money owed to suppliers by your business. It displays:
- The total amount of the bill
- The sum paid
- The remaining sum owed
- Ageing of amounts due
This helps with better vendor relationship management and outgoing payment planning.
To sum up, these AR/AP reports are essential for managing cash flow because they tell you who is owed money, who you must pay, and how quickly these transactions are completed. They are effective tools for finance teams because they can be filtered by dates, parties, and terms.
2.2 Trial Balance
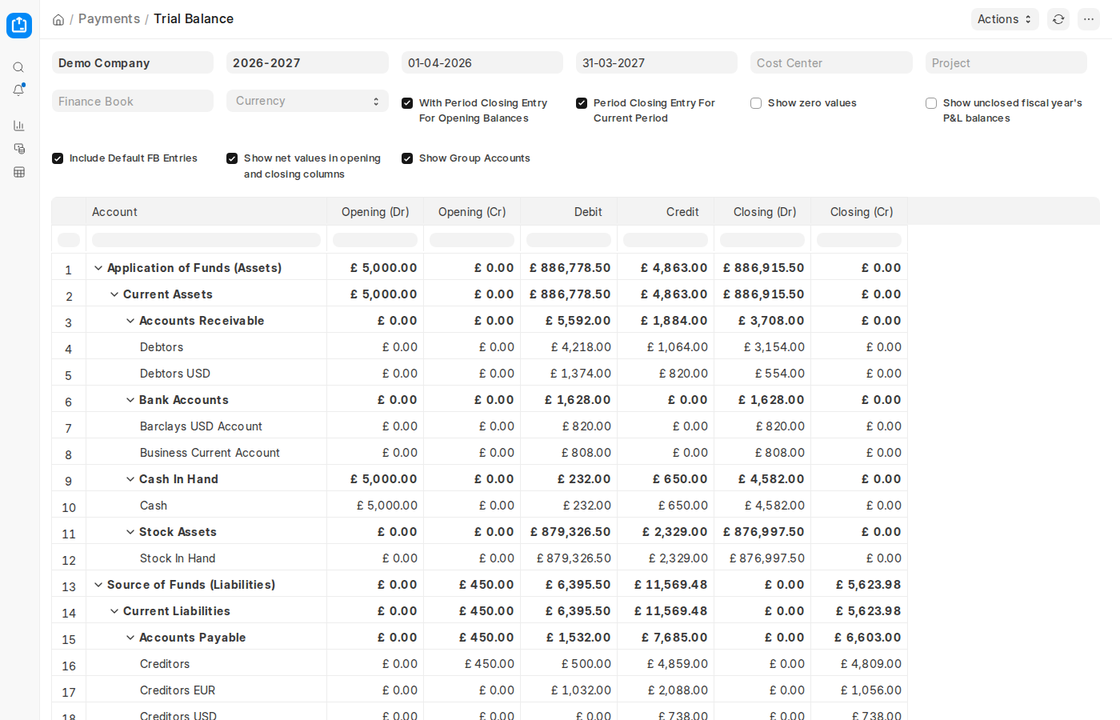
One of the most basic financial reports in accounting is the trial balance. For a specific reporting period, it offers a snapshot of all account balances, both credit and debit. To access the report, go to:
Verifying the double-entry bookkeeping system’s mathematical accuracy is the primary goal of the trial balance. It guarantees that there is a matching credit entry for each debit entry made in the system and that the sum of the two sides should equal one another. Otherwise, it usually indicates a mistake in ledger postings or journal entries.
The ERPNext Trial Balance Report’s columns include:
1. Opening (Dr.): This displays an account’s initial debit balance as of the chosen period’s “From Date.” This is the balance carried forward prior to any July transactions, for instance, if your period begins on July 1st.
2. Opening (Cr): For the same “From Date,” this is the opening credit balance. Credit balances are naturally present in some accounts (such as Revenue or Liabilities), and they show up here.
3. Debit: The total number of debit transactions that were posted to the account over the chosen time period is shown in this column. For instance, assets or expenditures rose.
4. Credit: This displays all of the account’s credit transactions during the chosen time frame, including increased liabilities and income.
5. Closing (Dr):
The debit balance (as of “To Date”) at the conclusion of the chosen period. It is computed as:
Opening + Debit − Credit (shown under Closing (Dr) when the result is a debit balance)
6. Closing (Cr):
This is the credit balance as of “To Date.” It is the outcome of:
Opening + Credit − Debit (shown under Closing (Cr) when the result is a credit balance)
2.2.1. Additional Options in the Trial Balance Report:
1. With Period Closing Entry For Opening Balances and Period Closing Entry For Current Period: Include or exclude the impact of Period Closing Vouchers (closing Profit and Loss to Retained Earnings).
2. Show zero values: Accounts with zero balance and no activity are hidden unless you tick this option.
3. Show unclosed fiscal year’s P&L balances: This option displays carried-over income and expense balances if you haven’t made a period closing entry for the prior year.
4. Show net values in opening and closing columns and Show Group Accounts change how balances and group accounts are shown.
All balances and transactions in the Trial Balance are shown in the company’s base currency, unless you choose another Currency in the filter.
2.3 Balance Sheet
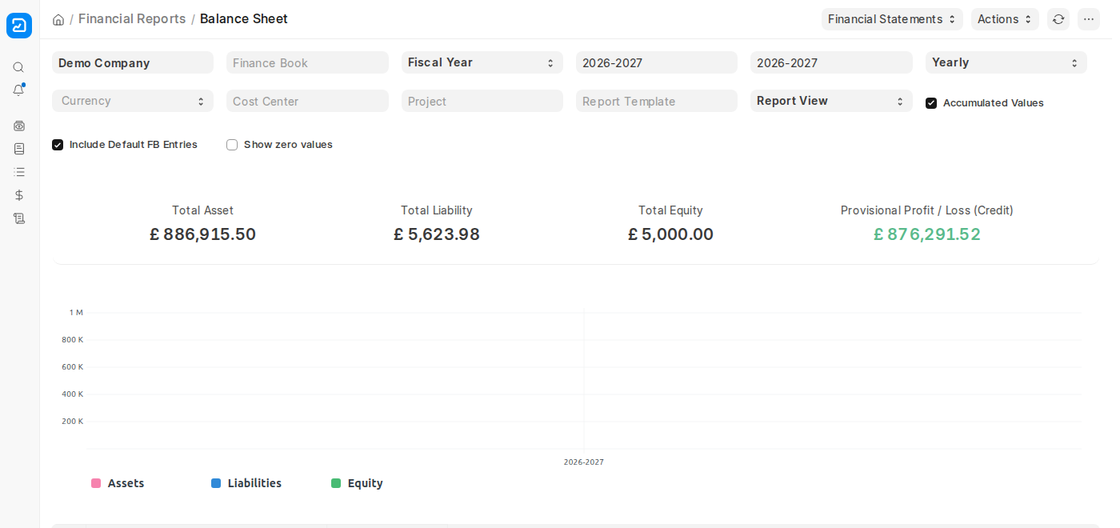
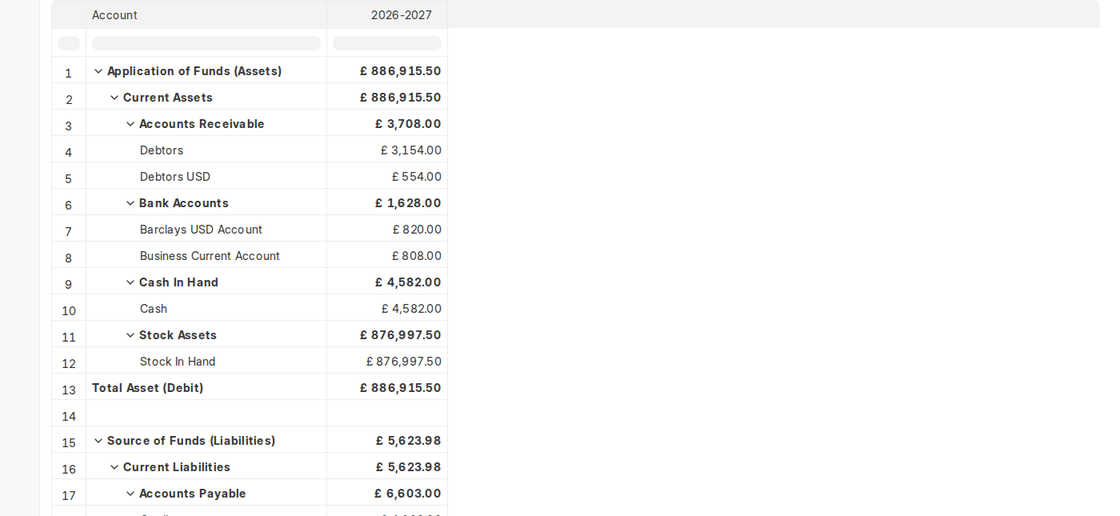
One important financial document that displays the company’s equity, liabilities, and assets as of a given date is the balance sheet. It shows the state of your company’s finances at that moment, including what you own and owe. This interactive report (Home > Financial Reports > Financial Reports > Balance Sheet) lets you compare balances across several years or periods and filter by year, cost centre, project or finance book. To properly analyse foreign figures, you can also alter the display currency.
2.4 Statement of Cash Flow
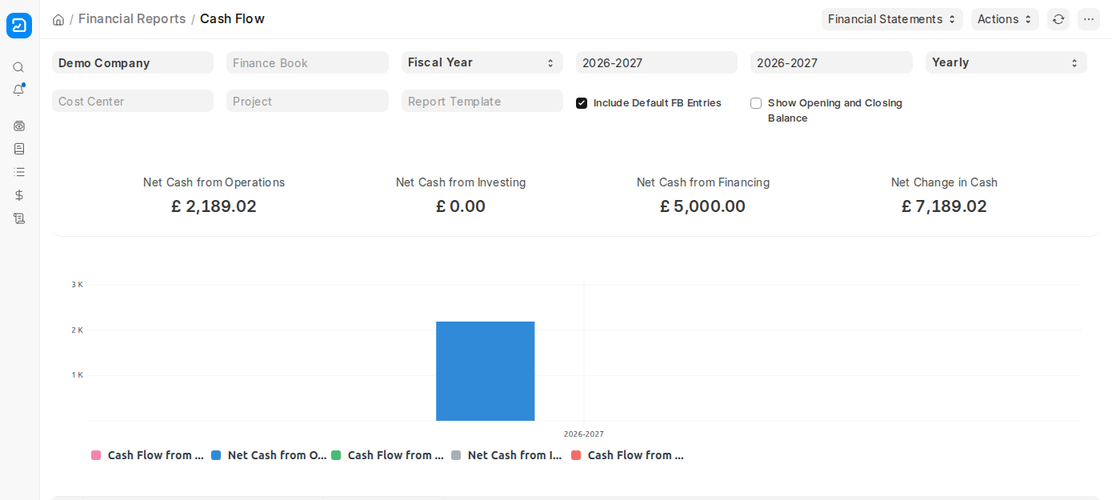
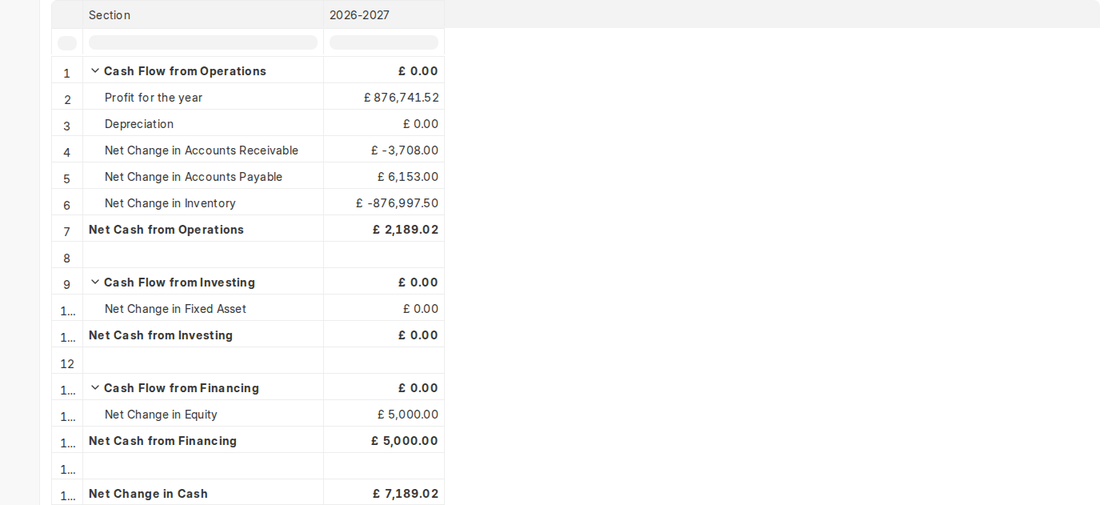
The actual inflow and outflow of cash and cash equivalents over a chosen time period are displayed in the cash flow statement. It aids in determining whether your company has enough cash on hand to pay for its operations, debts, and investments. ERPNext helps you examine how money is being made and spent by classifying cash flows into operating, investing, and financing activities (Home > Financial Reports > Financial Reports > Cash Flow).
2.5 Statement of Profit and Loss (P&L Statement)
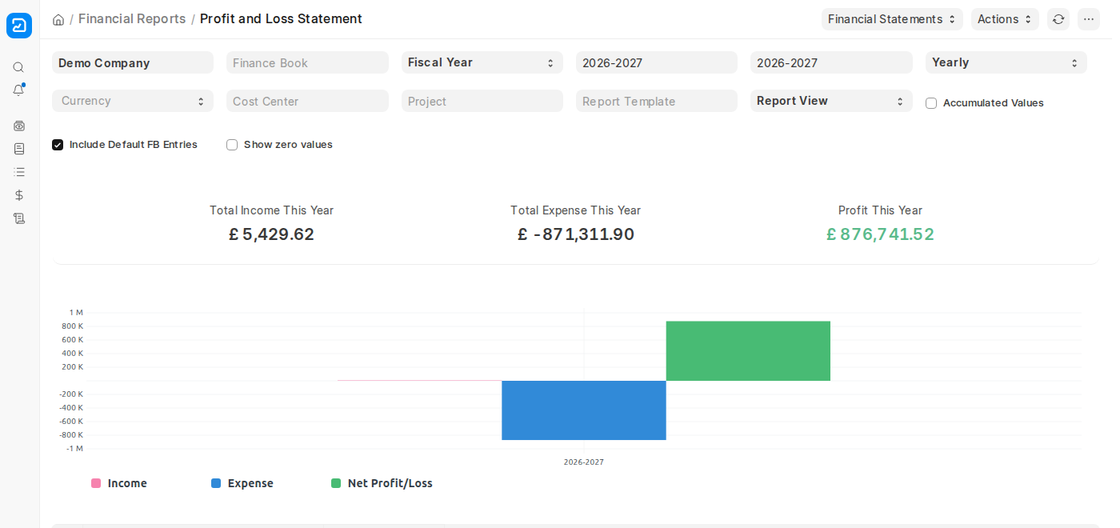
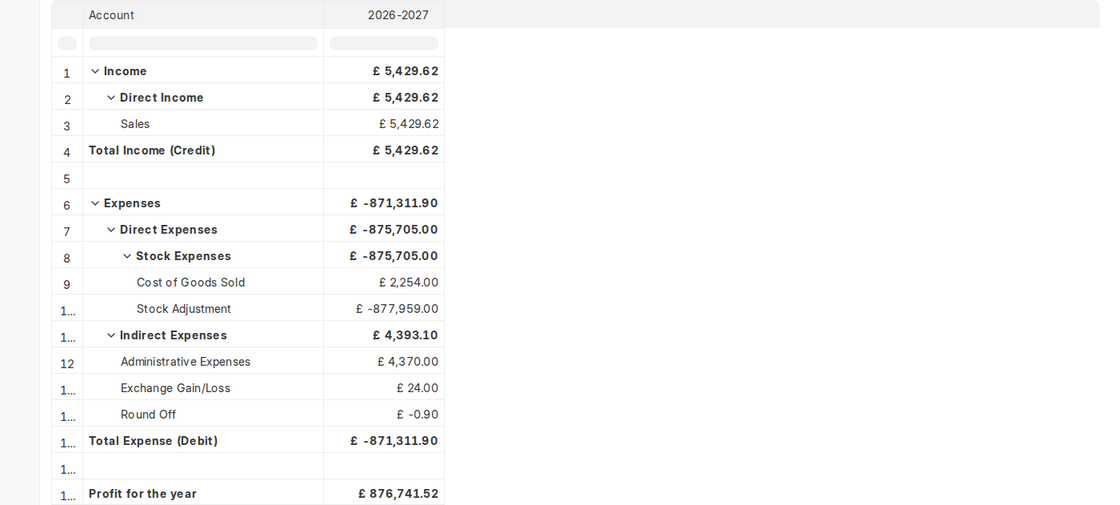
The income statement, sometimes referred to as the profit and loss statement, provides a summary of the net profit or loss, expenses, and revenues for a given time period. It is employed to evaluate the profitability, efficiency, and performance of the business (Home > Financial Reports > Financial Reports > Profit and Loss).
ERPNext provides the option to filter by project, cost centre, or finance book and compare P&L over a number of years or periods. Additionally, you have the option to switch between accumulated and period-only balances and view monthly or quarterly trends.
2.6 Financial Statements Consolidated
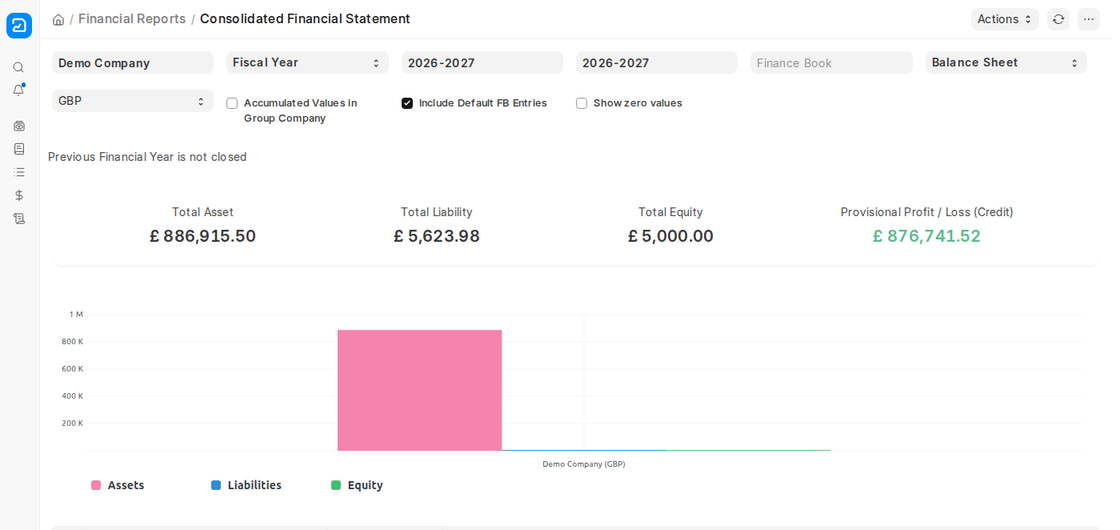
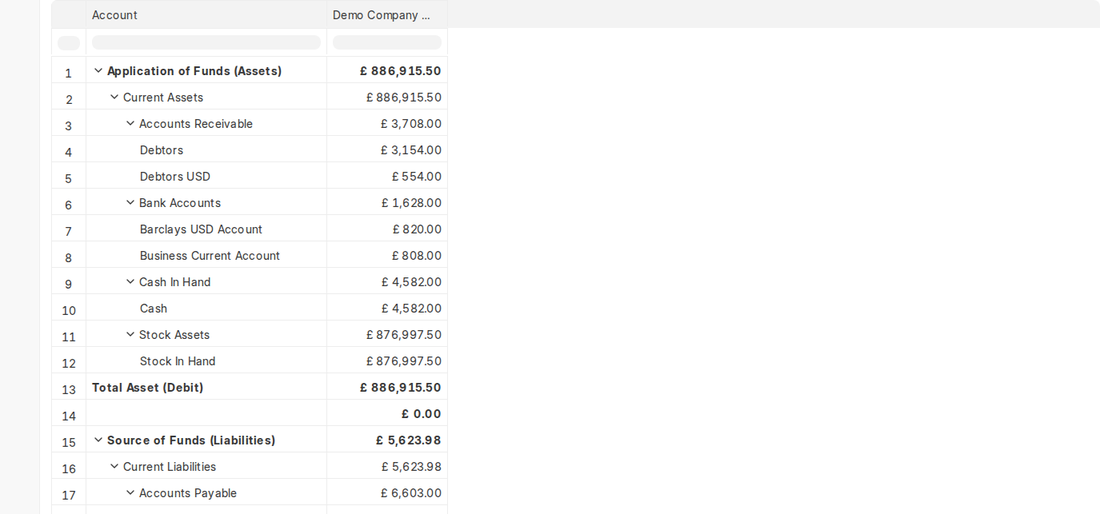
When your company has several businesses (subsidiaries) operating under a Group Company structure, you use this report. All companies’ balance sheets, P&Ls, and cash flows are combined into a single report called the Consolidated Financial Statement (Home > Financial Reports > Financial Reports > Consolidated Report). Select the parent company and choose the Report (Balance Sheet, Profit and Loss Statement or Cash Flow).
ERPNext shows the combined totals for the entire group as well as the financials of each company separately. Holding companies or businesses that manage multiple legal entities under one roof is incredibly helpful.
2.7. Financial Ratios report
ERPNext’s Financial Ratios Report (search for Financial Ratios in the search bar) is a helpful resource for assessing your company’s financial standing. These ratios transform information from your financial statements, such as the cash flow, income statement (P&L), and balance sheet, into useful indicators. You can learn more about your company’s profitability, liquidity, and leverage by using these ratios. They are frequently used by management, auditors, and investors to help them make well-informed decisions.
Calculation Assumptions:
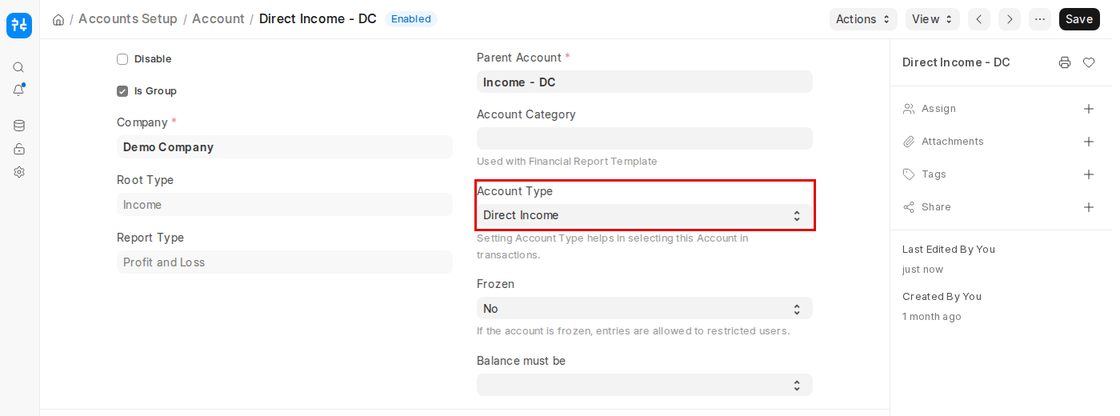
- Net Sales = Direct Income
- Direct Income = Credit Sales
- Credit Purchases = Direct Cost
- Shareholder Fund (SHF) = Total Assets – Total Liabilities
- Net Profit After Income & Taxes (NPAIT) = Total Income – Total Expense
2.7.1. Liquidity ratios
These ratios measure your business’s ability to meet short-term obligations; in other words, are you able to pay your bills?
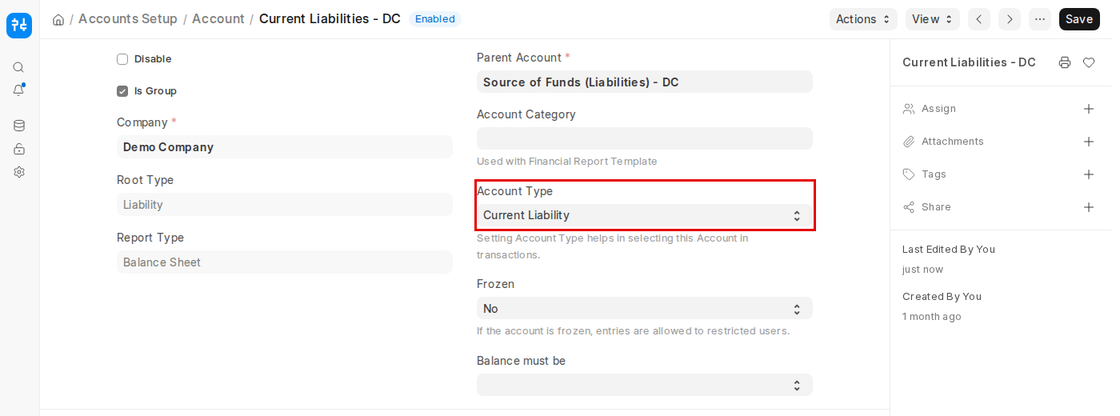
2.7.1.1. Current Ratio = Current Assets / Current Liabilities
- This ratio lets you know if your business has enough short-term assets to pay off its short-term debts.
- In general, a value larger than one indicates strong liquidity.
2.7.1.2. Quick Ratio = Quick Assets / Current Liabilities
- Since inventories are not included in current assets, this is a more stringent test of liquidity.
- It indicates whether you can pay short-term debts without using stock.
To make these function in ERPNext:
Make sure the Chart of Accounts has the appropriate account types set on the group accounts (Account Type field of the Account).
- Current Assets: Cash, bank accounts, receivables, etc.
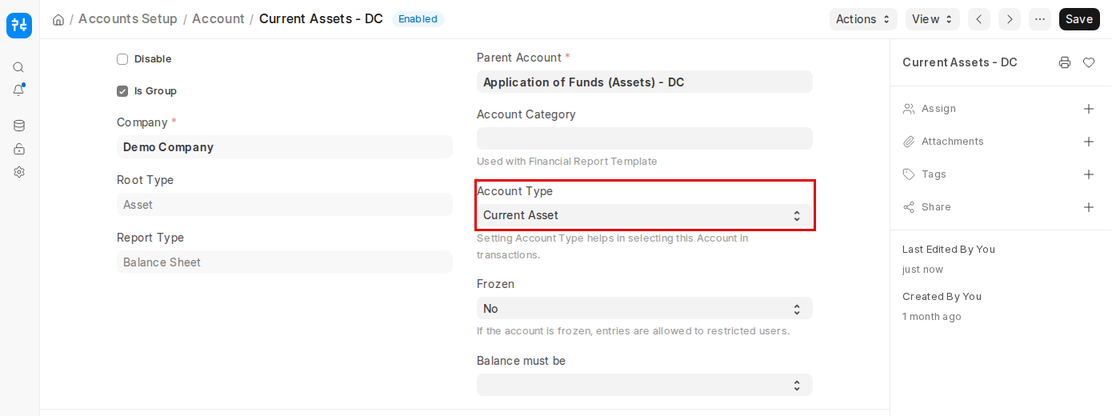
- Current Liabilities: Short-term loans, payables, etc.
2.7.2 Solvency Ratios
These ratios give you insight into your company’s debt load, profitability, and asset utilisation.
2.7.2.1 Debt-Equity Ratio = Total Liabilities / Shareholders’ Fund (SHF)
- calculates your financial leverage, or the extent to which you are dependent on debt.
- A higher ratio means higher risk.
2.7.2.2 Gross Profit Ratio = (Net Sales-COGS) / Net Sales
- Shows your profit after subtracting the cost of goods sold.
- Higher means better profitability.
2.7.2.3 Net Profit Ratio = NPAIT / Net Sales
- Shows your net profit for each rupee sold.
- Reflects overall efficiency.
2.7.2.4 ROA (Return on Assets) = NPAIT / Total Assets
- Shows the efficiency with which your assets produce profit.
2.7.2.5 NPAIT / Shareholders’ Fund = Return on Equity (ROE)
- Shows the rate of return on investment for shareholders.
2.7.3. Turnover ratios
These ratios measure how well you use your resources and assets over time.
2.7.3.1. Fixed Asset Turnover Ratio = Net Sales / Fixed Assets
- Shows how effectively you use your fixed assets to generate sales.
2.7.3.2. Debtor Turnover Ratio = Net Sales / Average Debtors
- This ratio measures how quickly you receive payments from clients.
- Higher ratio means faster collections.
2.7.3.3. Creditor Turnover Ratio = Direct Expense / Average Creditors
- Shows how often you pay your suppliers.
- A lower ratio may indicate delayed payments.
2.7.3.4. Inventory Turnover Ratio = COGS / Average Stock
- Shows how often your inventory is sold and replaced.
- Higher ratio = efficient inventory management.
Average Formula:
For stock, debtors and creditors: (Opening balance + Closing balance of the period) / 2.
3. Taxes
3.1. Sales and Purchases Register
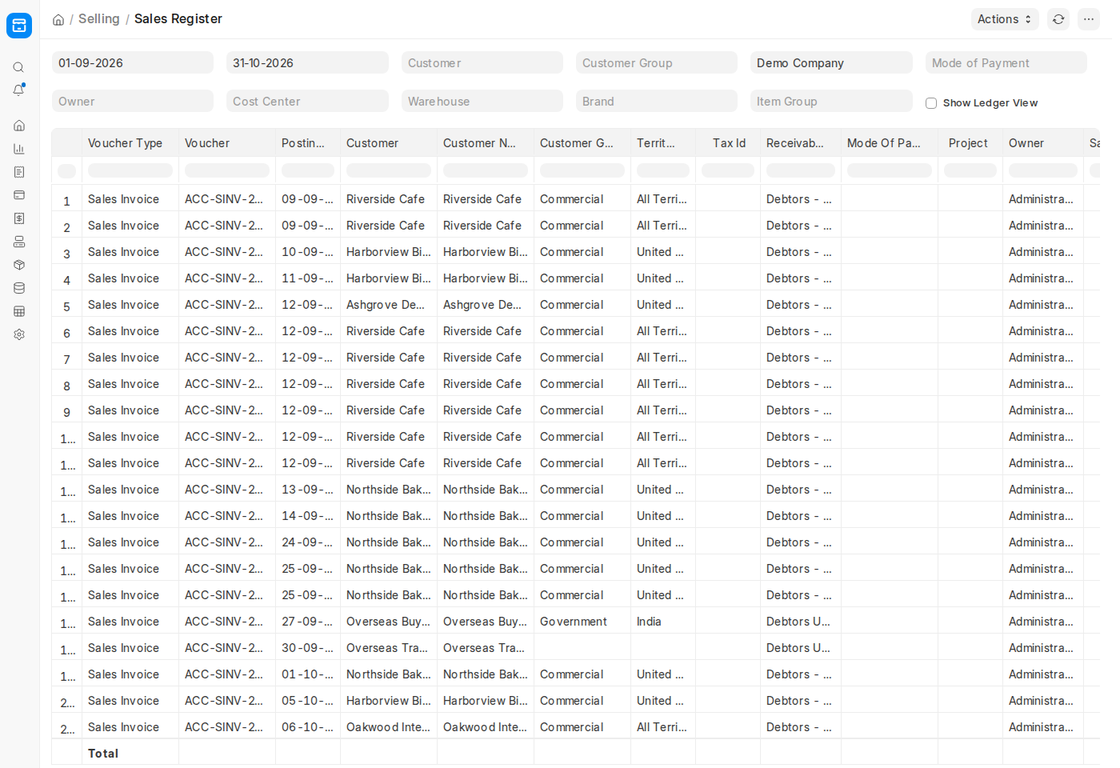
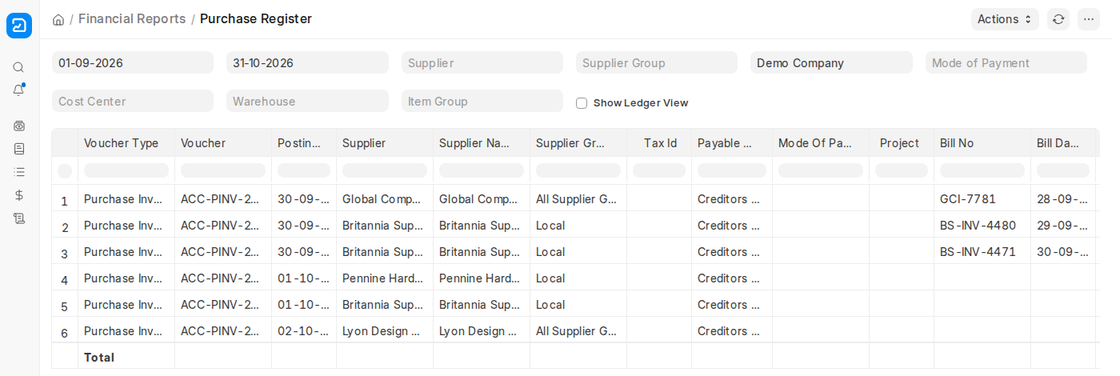
ERPNext’s Sales and Purchase Register reports (Home > Financial Reports > Registers) offer a comprehensive list of every sales invoice and purchase invoice produced within a chosen time frame. Columns for invoice amount, tax amounts, and net totals, broken down by specific tax types (such as VAT, GST, etc.), are included in these reports.
You can easily keep track of how much tax was paid to suppliers or collected from customers because each tax component is displayed in its own column. When preparing statutory tax filings or reconciling with government tax requirements, this structure is extremely beneficial.
4. Budget and Cost Centre
4.1. Budget Variance
To access this, go to:
ERPNext’s Budget Variance Report facilitates the comparison of your budgeted and actual expenses for particular cost centres and accounts. Budgets can be allocated to expense accounts, and you can track how much of the budget has been spent over a chosen time frame—monthly, quarterly, or annually.
The report helps you better manage your finances and prevent overspending by displaying the variance, or the difference between actual spending and the budgeted amount. It is an essential tool for tracking performance and financial planning.
5. Analytics
5.1. Sales Invoice Trend
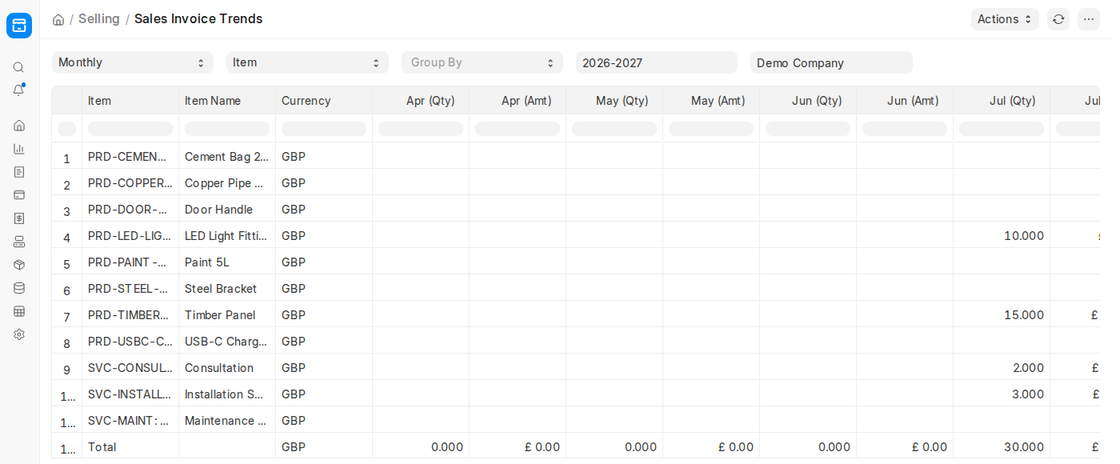
ERPNext’s Sales Invoice Trends report (Home > Financial Reports > Profitability) gives you a comprehensive picture of your sales performance over time. Grouped by month, quarter, half-year, or year, it displays trends based on invoice data, including quantity sold and sales amount.
This aids companies in determining their top-selling items, tracking seasonal demand, and analysing sales performance patterns over predetermined periods of time. Based on past data, it’s a useful tool for strategic planning and sales forecasting.
5.2. Purchase Invoice Trends
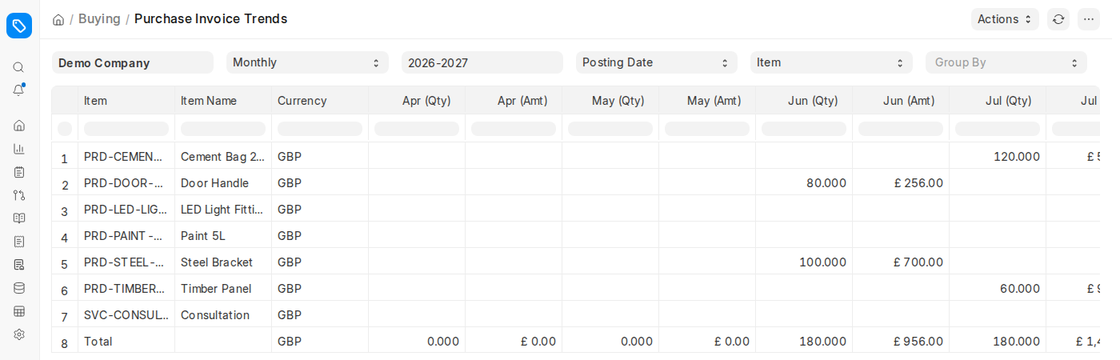
The monthly, quarterly, half-yearly, or annual purchasing activity of your business is tracked by the Purchase Invoice Trends report. It assists you in identifying your most frequently purchased items and general purchasing patterns by displaying the quantity of items purchased as well as the total purchase value.
Maintaining ideal inventory levels, predicting future procurement requirements, and managing supplier relationships can all benefit from this trend analysis.
6. To Bill
6.1. Delivered Items To Be Billed
All of the items that have been delivered to clients but for which a sales invoice has either not been created or has only been partially created are listed in this report. In order to guarantee prompt invoicing, it assists the sales and accounts teams in tracking unbilled deliveries. Accurate cash flow management and revenue recognition depend on this report. Businesses can improve their accounts receivable cycle and minimise billing delays by pursuing these outstanding invoices.
6.2. Received Items To Be Billed
All goods that have been received from suppliers but for which a purchase invoice has not yet been issued or has only been partially issued are listed in the Received Items To Be Billed report. This makes it easier to make sure that all incoming inventory is accurately tracked down and compared to supplier invoices. Additionally, it guarantees accurate expense recognition and avoids missing payables. Procurement and finance teams can use the report to confirm which receipts are still awaiting billing.
7. Other Reports
7.1. Party Type Trial Balance
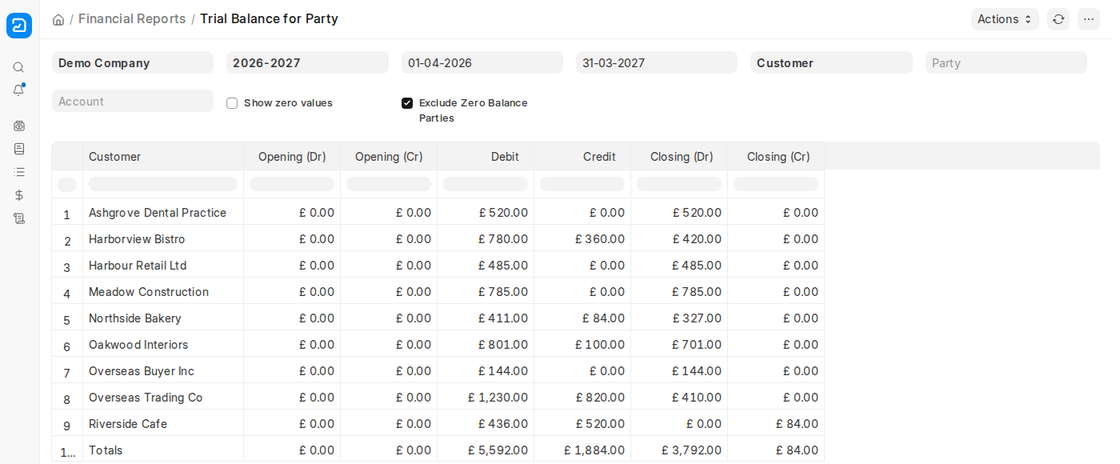
The Trial Balance for Party report (Home > Financial Reports > Other Reports) shows the opening balance, debit, credit and closing balance of each party of the selected Party Type (Customer, Supplier, Employee, Shareholder, etc.), with a total at the bottom.
It’s helpful when you want to examine your payables and receivables party by party for a period.
7.2. Customer Credit Balance
Each customer’s credit limit, amount owed, and available credit balance are displayed in this report. It assists in determining which clients are over or within their credit limit. Companies use this data to determine whether to ask for payment before completing new orders or to keep making sales on credit. It’s particularly helpful for managing credit and lowering the likelihood of bad debts.
Visit Us Here